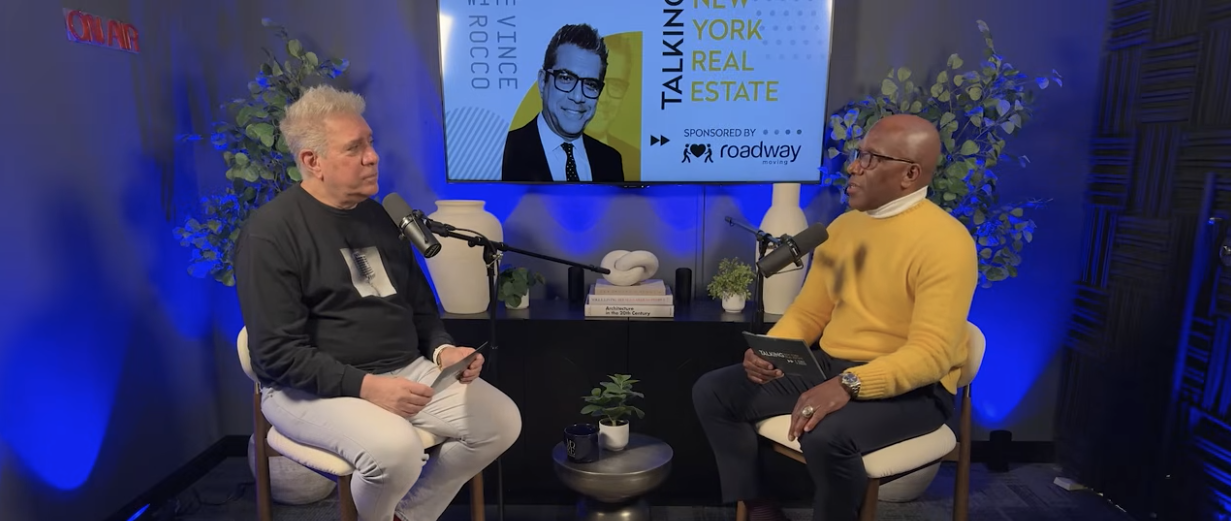
In a recent episode of Vince Rocco’s Talking New York Real Estate featuring Steven Bailey, Senior Account Manager of Roadway Moving & Storage, we took a closer look at what real movement data reveals about luxury demand in New York City.
Rather than relying solely on contracts or closed sales, this analysis examines quote requests and completed moves — offering a forward-looking indicator of where buyers are actively planning to relocate.
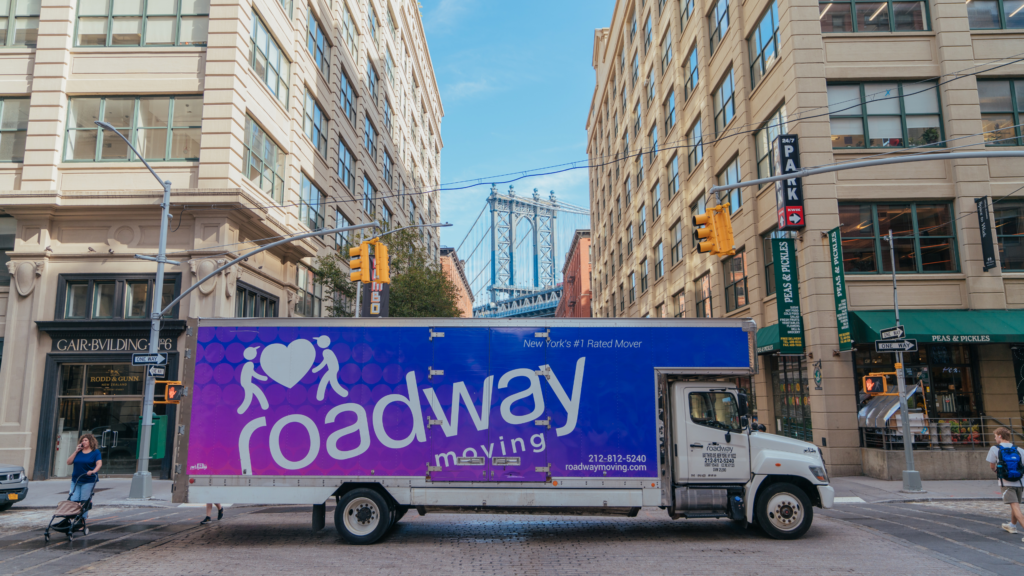
Roadway Moving is a white-glove moving and storage company in New York City specializing in complex, high-value residential relocations across Manhattan and Brooklyn, while also supporting local, long-distance, and interstate moves nationwide. Through its real-time operational visibility into high-end relocations in Manhattan and Brooklyn, the company maintains proprietary insight into where luxury activity is actually concentrating.
Below is a breakdown of the 2025 data and what it tells us about how — and where — luxury demand is concentrating across the city.
Data Scope & Methodology
This analysis is based on two datasets:
- Moves originating in New York City and ending in New York City
- Moves originating in other states and ending in New York City
Demand is measured by quote requests.
Luxury is defined solely by destination ZIP codes and neighborhoods, using standard broker groupings.
Storage-only jobs were excluded.
Timeframe covered: Calendar year 2025, with comparisons to the same months in 2024 where relevant.
Borough-Level Luxury Demand Distribution
When looking at total luxury-destination quote requests in 2025:
- Manhattan: ~64%
- Brooklyn: ~28%
- Queens: ~8%
- Staten Island: <1%
Manhattan continues to dominate luxury demand by a wide margin, but Brooklyn holds a meaningful secondary position — nearly a third of total activity.
Demand by Luxury Cluster (ZIP-Based Groupings)
Using broker-standard neighborhood groupings, demand is concentrated in a relatively small number of core clusters:
- Upper East Side + Upper West Side (combined): ~27%
- Brownstone Brooklyn: ~18%
- Midtown prestige areas: ~16%
- Downtown Westside luxury: ~13%
- Williamsburg + Greenpoint: ~9%
- Financial District luxury: ~9%
- Emerging luxury pockets (primarily Long Island City): ~9%
The key takeaway: demand remains centered in established luxury neighborhoods rather than meaningfully shifting outward.
Top Destination Neighborhoods in 2025
A handful of neighborhoods account for more than half of all luxury-ZIP demand.
Top individual destinations include:
- Upper East Side: ~9%
- Financial District + Battery Park City: ~8%
- Brooklyn Heights + DUMBO: ~7%
- Long Island City: ~6%
- Chelsea: ~6%
- Williamsburg: ~5%
- Yorkville + Carnegie Hill: ~5%
- West Village + Greenwich Village: ~5%
- Upper West Side (Lincoln Square / Central Park West): ~5%
- Greenpoint: ~4%
Together, these neighborhoods represent the majority of luxury-destination activity across the city.
Quarter-over-Quarter Shifts (Q3 → Q4 2025)
From Q3 to Q4 2025, demand declined across nearly all luxury neighborhoods — consistent with typical New York seasonality.
However, the scale of the pullback varied:
Larger late-year slowdowns (50–70% QoQ declines):
- Downtown Westside luxury
- Midtown East / Park Avenue
- Flatiron / Gramercy
- Financial District
More stable year-end interest:
- Uptown neighborhoods
- Brownstone Brooklyn
This suggests steadier buyer commitment in established residential enclaves compared to more transaction-sensitive luxury submarkets.
Year-over-Year Comparison (Q4 2025 vs. Q4 2024)
Several core luxury neighborhoods recorded higher request volumes in Q4 2025 than in Q4 2024, including:
- Long Island City
- Financial District
- Upper East Side
- Chelsea
- Upper West Side
- Brooklyn Heights / DUMBO
- West Village
While 2024’s base was smaller, the data indicates that late-2025 interest levels were meaningfully higher even after accounting for seasonality.
6. Internal NYC Movement: The Real Driver
One of the most important findings: luxury demand is primarily driven by internal New York City movement.
A significant share of activity consists of same-neighborhood moves, including:
- Upper East Side → Upper East Side
- Financial District → Financial District
- Brooklyn Heights / DUMBO → Brooklyn Heights / DUMBO
- Chelsea → Chelsea
- Park Slope → Park Slope
Cross-neighborhood moves also tend to be short and highly localized.
This reinforces the idea that much of the luxury market is driven by upgrades, downsizing, lifestyle adjustments, and inventory shifts — not external migration alone.
7. Inbound Demand from Other States
Inbound movers support overall activity, but they do not drive the majority of luxury demand.
The most common origin states:
- California
- New Jersey
These buyers tend to concentrate in:
- Downtown Westside luxury neighborhoods
- Upper East Side
- Midtown East
- Brooklyn Heights / DUMBO
- Williamsburg
- Greenpoint
Inbound demand remains meaningful — but the core engine of the market is still local.
What This Means for the Luxury Market
In volume terms, luxury demand in New York City:
- Is highly concentrated in a limited set of neighborhoods
- Is led by Manhattan, with Brooklyn as a strong secondary market
- Is driven primarily by internal city movement
- Shows a high share of same-neighborhood and short-distance relocations
- Exhibits seasonal slowdowns — but at higher overall interest levels than the prior year
The narrative of outward migration or broad dispersion simply isn’t reflected in the movement data. Luxury demand remains disciplined, localized, and centered in established prime neighborhoods.
As discussed in the episode with Steven Bailey, understanding movement patterns provides a real-time lens into where buyer conviction is strongest — and where it’s likely to remain concentrated moving forward.
Leave a Reply