
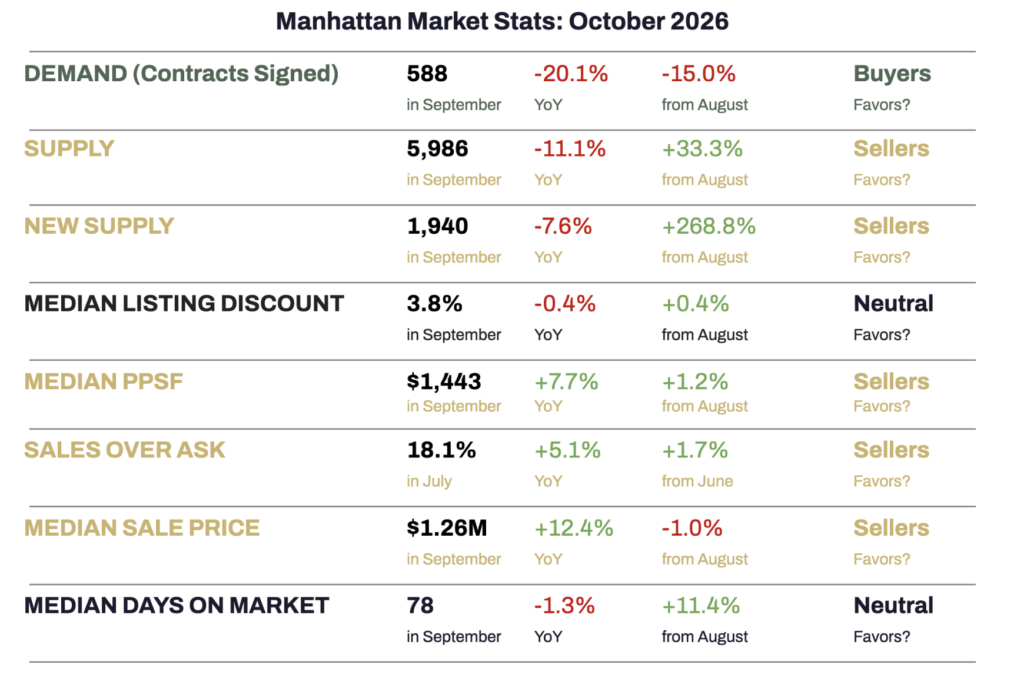
The story in Manhattan remains supply, or the lack of it. September brought the expected increase in listings after the summer slowdown, but the rebound was smaller than I anticipated. Meanwhile, buyers continued to move at very different speeds depending on their price point, financing needs, and willingness to renovate.
Supply Rebounded. Choice Remains Limited.
Manhattan ended September with 5,986 properties for sale, up 33.3% from August but still 11.1% below last September. Overall supply remains near a nine-year low for this time of year, going back to 2017.
As I discussed in my recent update, August’s unusually steep decline in supply temporarily exaggerated an existing shortage. Manhattan was already running below previous years before the summer slowdown. The removal of properties from public marketing widened that gap considerably. September’s rebound brought inventory back toward its earlier relationship with recent years, but the underlying shortage remains.
Given the number of properties temporarily withdrawn by Compass and its affiliated brands in August, I expected more inventory to return in September. I was too optimistic about how strongly that pendulum would swing back.
There were 1,940 new listings in September, approximately 12% above the long-term September average of 1,730. Yet that was down 7.6% from last September’s roughly 2,100 listings and represented the third-lowest September total in the past decade.
How can new supply be above average and still near a ten-year low? The comparison periods matter. The long-term averages reach back to 2009 and include the more supply-constrained years from 2009 through 2015. Those years pull the average down. Since 2016, listing activity has generally been higher. September can therefore exceed the long-term average while still falling near the bottom of the past decade’s range.
The same distinction applies across price points. New listings below $4 million were approximately 11% above their long-term September average and around the middle of the past decade’s September results. At $4 million and above, new listings were approximately 21% above their long-term average. Even so, luxury saw its fewest new listings for any September since 2020, tying with 2017 for the second-lowest September total in ten years.
How much of September’s incoming inventory was truly new? Preliminary estimates from UrbanDigs and RealPlus suggest that only 6% to 15% of September’s listings were listed in the preceding six months. This is a very difficult metric to define and measure; hence the wide range. These estimates may evolve, but they suggest that the anticipated wave of returning inventory was smaller than expected.
For buyers, the result is still limited choice. For sellers, it means less competition, but the advantage depends heavily on the property. Well-presented, move-in-ready homes remain especially appealing to buyers who want to avoid the cost, time, and uncertainty of renovating. Sellers of those properties can have pricing leverage when their asking prices align with the market. Homes requiring substantial work face a smaller audience and often more pressure to negotiate.
Low inventory alone does not recreate the conditions of 2012-2015, when buyers felt compelled to act quickly, prices rose more rapidly, and purchasers were more willing to take on a renovation. Today’s buyers are patient, selective, and attentive to value. A shortage of alternatives does not necessarily persuade them to pursue a home they consider overpriced or unsuitable.
Luxury Strength Masks a Slower Broader Market
September’s contract activity reflected that caution. Manhattan recorded 588 signed contracts, down 20.1% from a year earlier and 15% from August. Activity was approximately 14% below the long-term September average of 687, making this the fourth-slowest September of the past decade.
The calendar offers some context. Labor Day fell on September 7, leaving a shorter post-holiday selling window than last year, and the Jewish holidays also affected the September calendar. Those factors can influence the timing of showings and decisions, although they do not fully explain the weaker results.
Below $4 million, buyers signed 511 contracts, approximately 18% below the long-term September average of 624 and the third-lowest September total in ten years.
Luxury told a different story. At $4 million and above, 77 contracts were signed, approximately 22% above the long-term average of 63. That was the third-strongest September of the past decade, behind only 2021 and 2024.
This continues a theme we have discussed throughout 2026: luxury’s resilience can obscure how much softer conditions are at lower price points. Manhattan’s market is moving along two different paths, and financing helps explain the divide.
According to Mortgage News Daily, the average 30-year fixed mortgage rate rose from 6.89% on September 1 to 7.60% on September 30, an increase of nearly three-quarters of a percent in a single month. That meaningfully changes costs for buyers who need a mortgage.
Affluent buyers often have more flexibility to pay cash or draw on other assets, making them less directly exposed to increases in mortgage rates. Buyers relying on financing have more reason to reassess their budgets or pause their searches. That does not make luxury immune to uncertainty, but it helps explain its relative strength.
Prices Are Firm. Pricing Still Matters.
Despite softer contract activity, reported sale prices continued to firm. Median price per square foot reached $1,443, up 7.7% year over year and 1.2% from August. The median sale price was $1.26 million, up 12.4% from last September, although down 1% from August.
I continue to find price per square foot more useful than the overall median sale price when assessing pricing trends because it accounts for differences in property size. Neither measure is immune to changes in the mix of homes sold, however, and closed sales reflect deals negotiated earlier. These gains do not mean that every Manhattan home has appreciated by the same amount.
Median time on market was 78 days, slightly shorter than last September but up from August. The median listing discount was 3.8%, although the room for negotiation varies considerably by property. Buyers should consider time on market alongside pricing history, condition, and comparable sales when evaluating an offer. For sellers, these figures reinforce the importance of entering the market at a price that attracts serious interest.
Looking ahead, higher borrowing costs and uncertainty surrounding the approaching midterm elections could contribute to a more subdued fall. A stronger winter or spring remains possible, but it is too early to assume that buyers who pause now will return on a predictable schedule.
For sellers, limited supply is helpful, but pricing and presentation still determine whether that advantage translates into a sale. For buyers, September brought more options, and properties needing work may offer more room to negotiate. Desirable, renovated homes can still attract competition.
The most useful question is how the market is behaving for the particular home you want to buy or sell. In Manhattan today, condition, price point, and financing can make that answer very different from the headline numbers.
📌 Data Sources: Data in this report were sourced from RealPlus, UrbanDigs, Marketproof Pro, and Mortgage News Daily
Leave a Reply