
The summer real estate market is often quieter than the spring and fall markets. Looking at the full season (which I am defining as Memorial Day through Labor Day) provides a useful view of the underlying market, particularly because a longer period helps smooth out week-to-week or month-to-month volatility that can distort shorter-term trends.
And this summer, the data tells a clear story: buyer demand remained remarkably steady compared with last summer in both Manhattan and Brooklyn. What separated the two markets was supply.
Manhattan experienced its slowest pace of new listings in at least 18 years, creating one of the tightest supply-demand environments we have seen in more than a decade.
Brooklyn experienced almost the opposite. Buyer demand remained strong, but sellers were considerably more active, providing buyers with more choice and keeping the overall market relatively balanced.
An Extra Week of Summer Changes the Headline Numbers
This year’s period between Memorial Day and Labor Day lasted 105 days, compared with 98 days in most years. That same extra week of summer occurred in 2009, 2015, and 2020, but most summers in the historical data are one week shorter.
That matters. An additional seven days naturally produces more contracts and more new listings, which makes some of this year’s raw totals look stronger than they really were.
For that reason, I looked at the market in three ways: total activity, activity per day, and the relationship between contracts signed and new supply.
The per-day numbers allow us to compare summers of different lengths on equal footing. And the absorption ratio, calculated by dividing contracts signed by new listings, tells us how quickly buyers absorbed the new inventory entering the market.
Once we account for the calendar, 2026 looks less like a story of accelerating demand and much more like a story of two very different supply environments.
Manhattan: A Market Defined by Scarcity
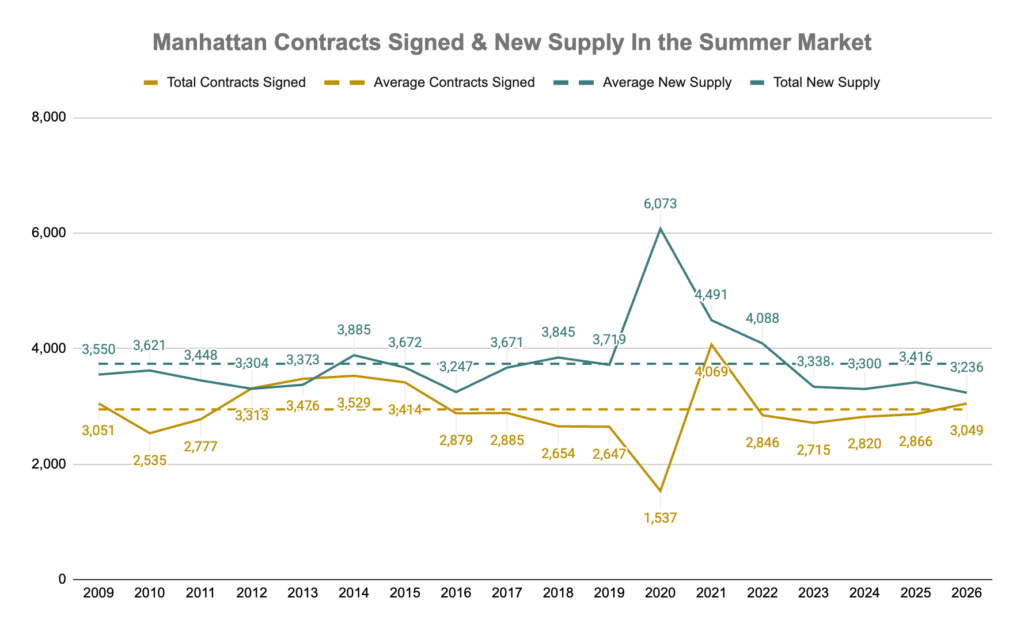
Between Memorial Day and Labor Day, 3,049 contracts were signed in Manhattan, up 6.4% from 2,866 during the same period last year.
That was Manhattan’s highest summer contract total since the post-pandemic surge of 2021 and slightly above the 18-year summer average of 2,948.
At first glance, that would appear to indicate that buyer demand strengthened considerably this summer. It didn’t. Adjusted for the additional week, Manhattan averaged 29.0 contracts signed per day, compared with 29.2 last summer and an 18-year average of 29.7.
Put another way, the raw contract count increased by 6.4%, but the underlying daily pace actually declined by approximately 0.7%.
Buyer demand was essentially unchanged from last summer and very close to its long-term historical pace.
Manhattan’s New-Listing Pace Fell to an 18-Year Low
Only 3,236 new listings came to market in Manhattan this summer. That was down 5.3% from 3,416 last summer and 13.4% below the 18-year summer average of 3,738.
More importantly, 3,236 was the fewest new listings recorded during any Memorial Day-to-Labor Day period in the entire dataset dating back to 2009.
And because this summer was one week longer, the normalized comparison is even more striking. New listings arrived at a pace of just 30.8 per day, compared with 34.9 last summer and the long-term average of 37.5.
That represents an 11.6% year-over-year decline in the daily pace of new supply and puts this summer approximately 18% below the historical average.
Even during the other 105-day summer periods in the dataset, Manhattan produced considerably more inventory. There were 3,550 new listings in 2009 and 3,672 in 2015. This year produced only 3,236, despite having the same number of days.
So while buyers continued purchasing homes at roughly the same pace as last summer, fewer owners chose to sell, and that imbalance became the defining feature of Manhattan’s summer market.
The Supply Shortage Extends Well Beyond This Summer’s New Listings
Manhattan entered Labor Day with approximately 4,300 homes for sale, placing total inventory near the bottom of the range we have seen over nearly two decades.
Looking at the longer-term inventory cycle, there appear to be only brief periods around 2013 and 2014 when Manhattan had fewer homes available for sale than it does today. For most of the period since 2007, buyers have had considerably more inventory to choose from.
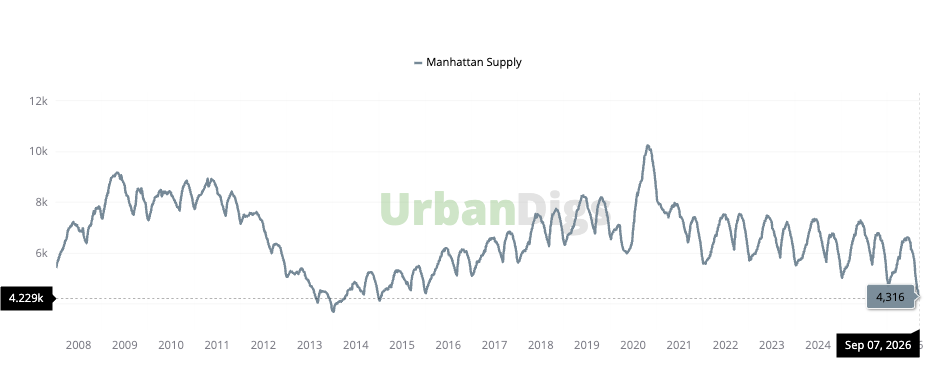
Manhattan did not enter the summer with an abundance of homes for sale and then simply experience a seasonal slowdown in new inventory. It entered the fall with both an unusually small overall pool of homes available for sale and the slowest summer pace of new listings in at least 18 years.
In other words, fewer new listings were being added to a market that was already historically undersupplied.
That helps explain why relatively ordinary buyer demand has been enough to create such a tight market. When the starting inventory is already low and fewer properties are arriving to replenish it, buyers do not need to become significantly more active for competition to increase.
What Could Limited Supply Mean for Pricing?
There is another historical comparison worth watching. The last time Manhattan inventory approached similarly low levels was around 2013 and 2014. During that period, Manhattan’s price per square foot began a meaningful move higher.
That does not mean today’s market will follow the same path. Interest rates, affordability, economic conditions, and the composition of available inventory are different today, and real estate markets rarely repeat themselves precisely. But the underlying supply-demand relationship is worth considering.
When buyer demand remains steady while the number of available homes declines, that imbalance can create upward pressure on pricing.
And there are already signs that Manhattan pricing has been firming. After a prolonged period in which prices remained relatively range-bound, price per square foot has recently moved back toward the upper end of its historical range and, according to recent analysis from UrbanDigs, is starting to break out to the upside based on August’s preliminary data.
The question heading into the fall is whether today’s unusually limited supply persists long enough to create more meaningful upward pressure on pricing, or whether favorable conditions and firmer prices encourage more owners to sell, bringing additional inventory back into the market.
That makes the relationship between supply, demand, and pricing particularly important to watch over the next several months.
94 Contracts for Every 100 New Listings
The current relationship between supply and demand helps explain why that pricing question is worth watching. Manhattan’s absorption ratio reached 0.94 this summer, meaning approximately 94 contracts were signed for every 100 new listings that came to market.
That compares with 0.84 last summer and an 18-year average of approximately 0.81.
More significantly, 2026 produced the third-highest summer absorption ratio in the entire 18-year dataset. Only 2012 (at 1.00) and 2013 (at 1.03) were tighter. That makes this Manhattan’s tightest summer supply-demand environment since 2013.
And that historical parallel is notable. The last time Manhattan’s summer absorption ratio was this high was also around the last time total inventory reached similarly scarce levels.
But understanding why today’s market became so tight is important. This was not an overheated market created by an extraordinary surge in buyer demand. Manhattan buyers were purchasing homes at almost exactly the same daily pace as last summer. The market tightened because supply contracted around them. That distinction matters for both buyers and sellers.
For sellers, fewer competing properties combined with a consistent buyer pool created a favorable environment, particularly for homes that were well-priced and well-presented.
For buyers, it meant competing over an unusually limited flow of new inventory. When desirable properties did come to market, fewer alternatives were available.
As I have discussed throughout August, some of Manhattan’s late-summer reported inventory decline was also affected by properties shifting away from public marketing. But this Memorial Day-to-Labor Day data reinforced the shortage of new sellers.
Brooklyn: Strong Demand, but Sellers Showed Up Too
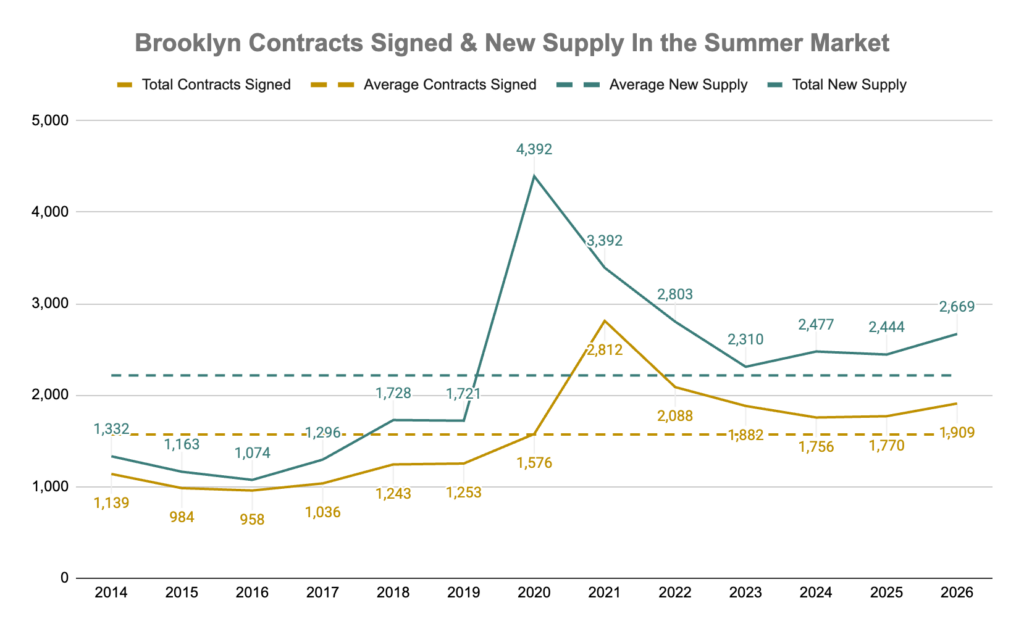
Brooklyn told a different story this summer. The borough recorded 1,909 contracts signed this summer, up 7.9% from 1,770 last year. On raw totals, that was Brooklyn’s strongest summer since 2022 and the third-highest contract total in the 13 years of available data, behind only the post-pandemic years of 2021 and 2022.
But once again, the extra week changes the comparison. Brooklyn averaged 18.2 contracts signed per day, compared with 18.1 last summer. So, although total contracts increased by nearly 8%, the underlying pace of buyer activity increased by just 0.7%. Year over year, demand was essentially flat.
But there is an important difference between Brooklyn and Manhattan. While Manhattan’s daily contract pace was slightly below its long-term average, Brooklyn’s remained approximately 15% above its 13-year average of 15.8 contracts per day.
The raw 1,909-contract total is impressive, but the normalized data gives us a better perspective. For example, Brooklyn recorded 1,882 contracts in 2023, slightly fewer than this year. But because those contracts were signed over 98 days, the daily pace was actually higher at 19.2.
Brooklyn Sellers Met That Demand With More Inventory
The bigger change again came from supply, although in Brooklyn it moved in the opposite direction. A total of 2,669 new listings came to market between Memorial Day and Labor Day, up 9.2% from 2,444 last summer and approximately 20% above the 13-year average of 2,215.
On a daily basis, Brooklyn averaged 25.4 new listings, up from 24.9 last summer and approximately 14% above its long-term average of 22.2.
Unlike the increase in raw contract activity, the increase in supply was not entirely a function of the longer calendar. The daily pace of new listings also increased.
Brooklyn, therefore, experienced something Manhattan did not: strong buyer activity accompanied by strong seller participation.
An Active Market With Selection
Brooklyn’s absorption ratio was 0.72, meaning approximately 72 contracts were signed for every 100 new listings that entered the market. That was unchanged from last summer and slightly below the 13-year average of 0.75.
It also sits toward the lower end of Brooklyn’s historical range. Only a few summers in the 13-year dataset produced lower absorption readings. But that should not be interpreted as evidence of a weak market. Brooklyn buyers were still signing contracts at a pace approximately 15% above the historical average. There was plenty of demand. There was simply enough new inventory to meet it.
That created a very different competitive environment from Manhattan. Buyers had more opportunities to compare properties and were less dependent on any single new listing. Sellers still benefited from an active pool of buyers, but they were competing with more inventory.
That makes pricing and presentation particularly important. A well-priced property that compares favorably with the alternatives can still attract significant attention and competition. But when buyers have more choices, properties that enter the market too aggressively priced or mispositioned can be easier to pass over.
Two Boroughs, Two Very Different Summer Markets
Putting Manhattan and Brooklyn side by side reveals an important takeaway from the summer. Buyer demand barely changed year over year in either borough once we adjusted for the extra week.
Manhattan went from 29.2 contracts per day last summer to 29.0 this summer. Brooklyn went from 18.1 to 18.2.
What changed was the amount of inventory available to those buyers. In Manhattan, new supply fell from 34.9 listings per day to 30.8, an 11.6% decline and the lowest pace in at least 18 years. That slowdown occurred while Manhattan’s overall inventory was already near the lowest levels we have seen in roughly two decades.
In Brooklyn, new supply increased from 24.9 listings per day to 25.4, already well above the borough’s historical norm.
That divergence produced two very different absorption environments. Manhattan: 0.94, compared with an 18-year average of 0.81. Brooklyn: 0.72, compared with a 13-year average of 0.75. Those numbers tell the summer story better than the raw contract totals alone.
Manhattan was supply-starved. Brooklyn was well supplied. Both had buyers.
One Important Difference Beneath the Borough-Wide Numbers
This analysis examines aggregate contract activity by borough, but the market has not performed uniformly across price points.
In Manhattan, contract activity at $4 million and above has generally been outperforming recent years, while activity below $4 million has been comparatively softer. Brooklyn has shown a similar pattern, with the $2 million-plus market outperforming the lower-priced segments.
That means the relatively steady borough-wide demand described above masks stronger performance at the higher end and weaker performance at the lower end in both markets.
The luxury buyer has remained comparatively confident, while affordability and financing costs continue to have a greater impact further down the price spectrum.
What It Means for Sellers
For Manhattan sellers, the summer ended with one of the most favorable supply-demand setups we have seen in more than a decade. But that advantage rests primarily on scarcity, not runaway demand. That is an important distinction. Low inventory can create competition and support pricing, but it does not mean buyers will overlook condition, value, or an unrealistic asking price.
Buyers today remain highly attuned to value. Properties they perceive as overpriced can still be ignored, even in a supply-constrained market, while homes that are well-priced, well-presented, and move-in ready tend to attract the strongest response.
That preference for turnkey properties has been an important feature of the market. Buyers may have fewer choices, but they are still distinguishing carefully between properties they believe justify their asking price and those that do not.
The opportunity for sellers lies in entering a market with relatively few competing properties, although that advantage can vary considerably by neighborhood, price point, and property type.
And if the current imbalance persists, limited supply combined with steady demand can create upward pressure on prices. Whether that happens will depend in part on how many sellers respond to the current environment by bringing their homes to market this fall.
Brooklyn sellers face a different environment. Demand remains historically healthy, but buyers have more options. That makes accurate pricing even more important. A strong market can still leave an overpriced property behind when buyers have enough alternatives to recognize better value elsewhere.
What It Means for Buyers
Manhattan buyers should see more inventory as the fall listing season gets underway, but they are entering that season from an unusually low supply base. The traditional September listing wave should provide more choice, including some inventory that was temporarily removed during August. The question is whether that new supply will be sufficient to meaningfully change the balance established over the summer.
If buyer demand remains near its current pace and new inventory continues to lag historical norms, the best-positioned properties are likely to remain competitive. And if the supply-demand imbalance persists, buyers should also be mindful of the potential for continued upward pressure on pricing.
Brooklyn buyers have a different set of conditions. They are participating in an active market, but one where supply has kept better pace with demand. That means more opportunity to compare properties, evaluate value, and remain selective, even though desirable and properly priced homes can still move quickly.
What I’m Watching This Fall
In Manhattan, the first question is how much new supply comes to market. Favorable conditions and firmer pricing could encourage owners who have been sitting on the sidelines to finally list. If that happens, the gap between supply and demand could begin to narrow.
If sellers remain reluctant, however, Manhattan could continue operating with an unusually tight supply-demand balance even as the normal fall listing wave arrives. And if steady demand continues to meet historically scarce inventory, the potential implications for pricing become increasingly important.
That is what makes the comparison with 2013 and 2014 worth watching. History does not tell us what happens next, but it does show us what can happen when sustained buyer demand meets unusually limited supply. There are important differences today. Buyers generally remain more measured, and affordability and financing costs continue to constrain portions of the market. At the same time, the higher end has been comparatively resilient, with luxury contract activity outperforming the broader market.
So I would not expect history to repeat itself exactly. But if Manhattan continues to combine steady demand with historically scarce inventory, the potential for additional upward pressure on pricing is difficult to ignore.
In Brooklyn, the question is different: how quickly will buyers absorb the elevated supply?
Demand remains healthy, but with new inventory also running well above historical norms, the pace of absorption will tell us whether the borough remains balanced or begins to tilt toward buyers. That is why, as we move into fall, the amount of new inventory matters, but the more important question is how quickly buyers absorb it.
After a summer in which aggregate buyer demand was consistent, that relationship between supply and absorption may tell us much more about the direction of the fall market than the headline inventory number alone.
Methodology: Summer is defined as the period from Memorial Day to Labor Day
Data in this report were sourced from RealPlus, UrbanDigs, Marketproof Pro, and Mortgage News Daily.
Leave a Reply