
More listings are back on the market, buyers are returning to open houses, and there are encouraging signs that offers are moving toward contract signing. But understanding this fall’s market requires putting August’s unusually sharp inventory decline into perspective.
For weeks, we’ve been discussing Manhattan’s limited supply and the properties temporarily removed from public marketing in August. Now that September’s rebound has progressed, the chart below tells a clearer story: the unusual August disruption has largely unwound, leaving Manhattan with the underlying supply constraint we were seeing before it began. That distinction matters. It changes how we interpret both the late-summer shortage and the fall recovery.
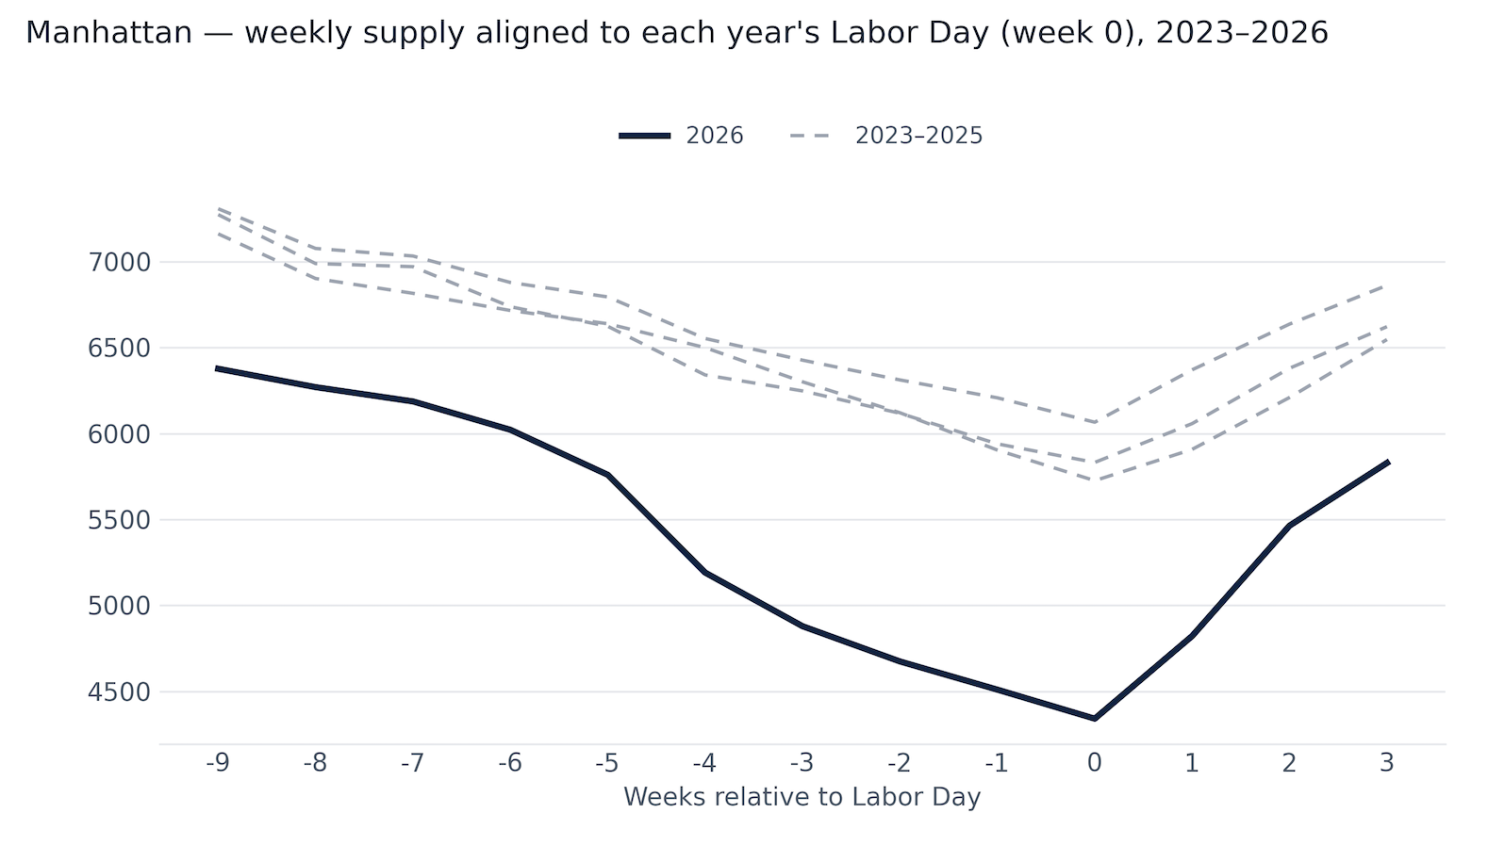
Manhattan currently has 5,829 active listings, up from its late-summer low of 4,341 and slightly above the 5,760 available at the end of July. Viewed only from that September low, the increase looks dramatic. Viewed across the full summer and into fall, it looks more like a return to the inventory picture we had before August’s unusually steep decline.
The following chart makes this particularly clear. Manhattan was already running below the previous three years in July. During August, the gap widened sharply as this year’s inventory moved further away from the usual seasonal pattern. With listings returning in September, that gap has narrowed, bringing it back toward where it stood before the disruption.
Data sourced from UrbanDigs
As I’ve discussed in previous updates, Compass and its owned brands removed listings from public marketing in August to re-list in the fall, in part to reset public-facing days-on-market counts. That activity contributed to the unusually low visible inventory heading into September. Read my previous analysis
In practical terms, those marketing decisions temporarily distorted the inventory picture. Removing a listing reduces the active count without necessarily indicating that the home sold or that the seller abandoned plans to sell. Bringing it back increases the count without giving buyers a property they haven’t seen before.
The recovery is consistent with much of the temporarily withdrawn inventory returning, although the aggregate chart cannot show the history of each individual listing. My read is that the temporary distortion has largely passed. The underlying shortage remains.
That is why September’s rebound shouldn’t be mistaken for a sudden abundance of homes, or August’s decline treated as evidence that buyers had absorbed all of that inventory. The longer view reinforces the point.
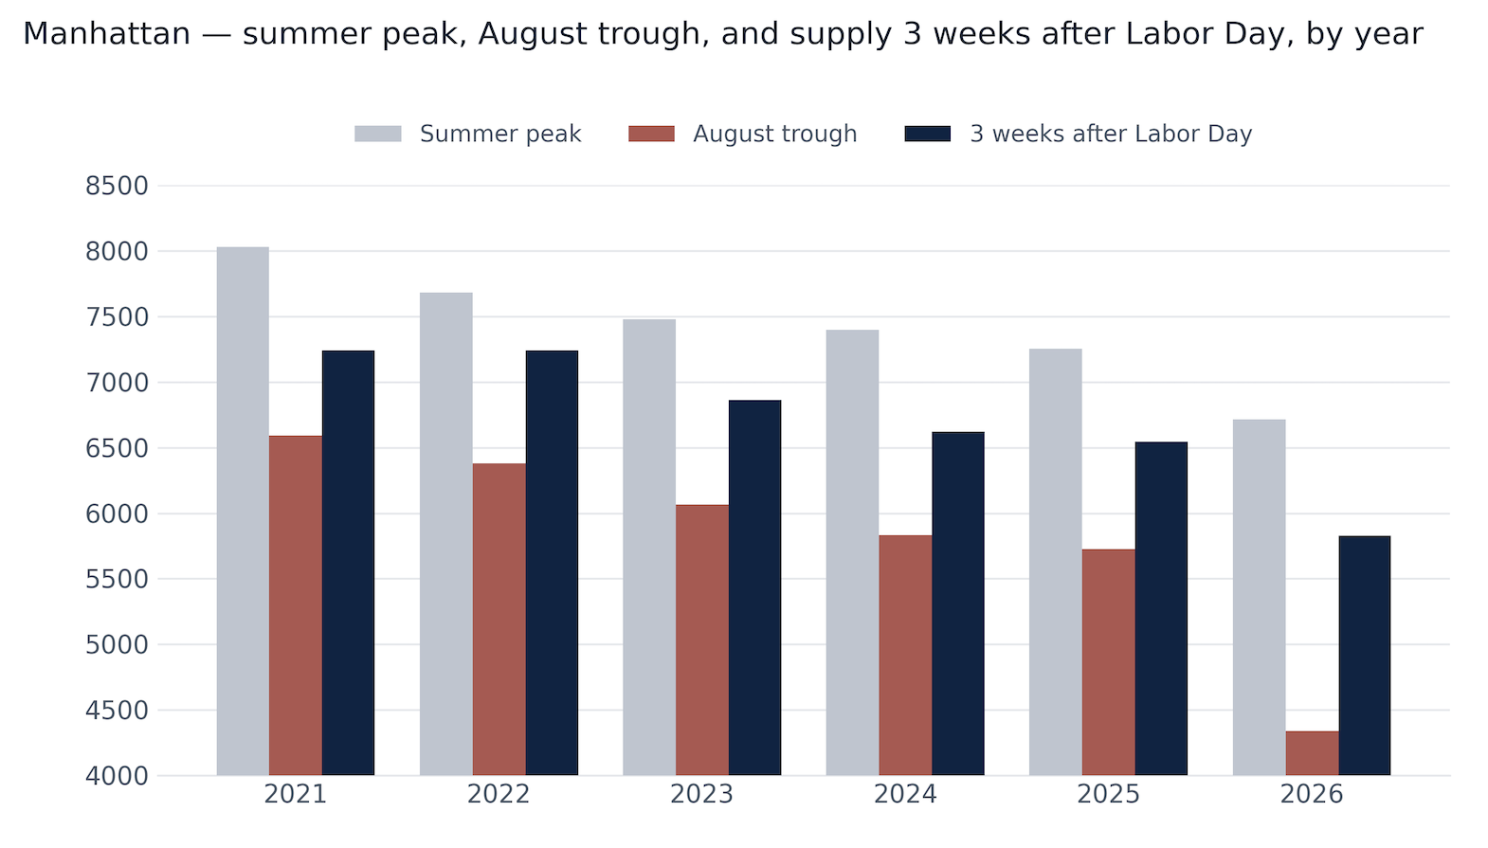
Manhattan’s summer inventory peak has declined every year since 2021, from 8,031 listings in 2021 to 6,714 this year. From that lower starting point, inventory fell approximately 35% heading into Labor Day, compared with roughly 17%–21% in the prior five years.
Even after the rebound, today’s 5,829 listings remain 11% below last year’s comparable level and roughly 19% below the levels seen in 2021 and 2022.
Data sourced from UrbanDigs
These comparisons align each year around Labor Day, so we’re measuring the same stage of the fall season.
For buyers, choices have improved considerably since late August. For sellers, the number of competing properties has increased. Both are happening within a Manhattan market that still has relatively limited inventory.
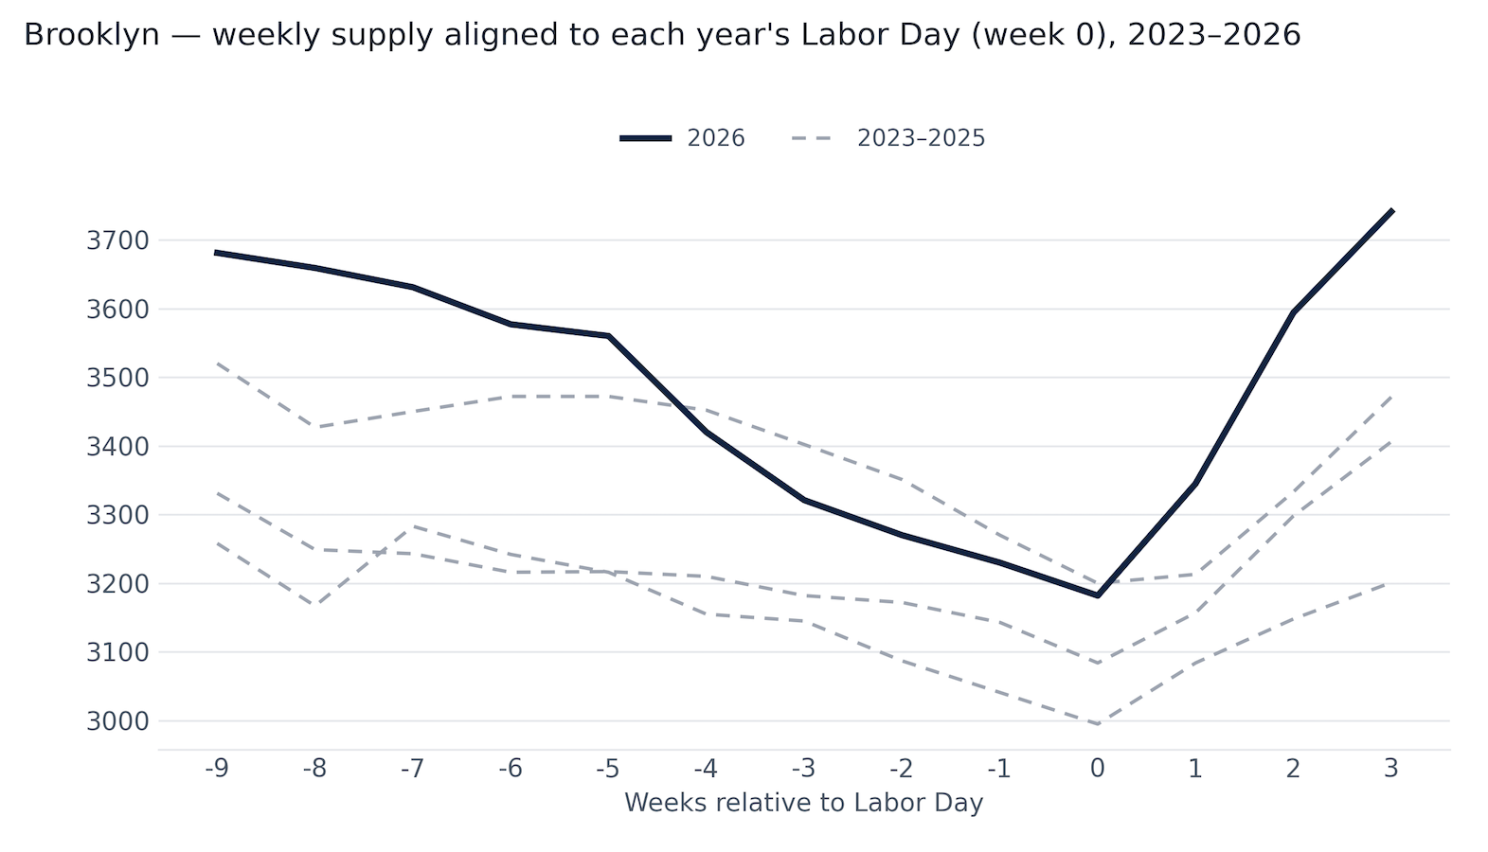
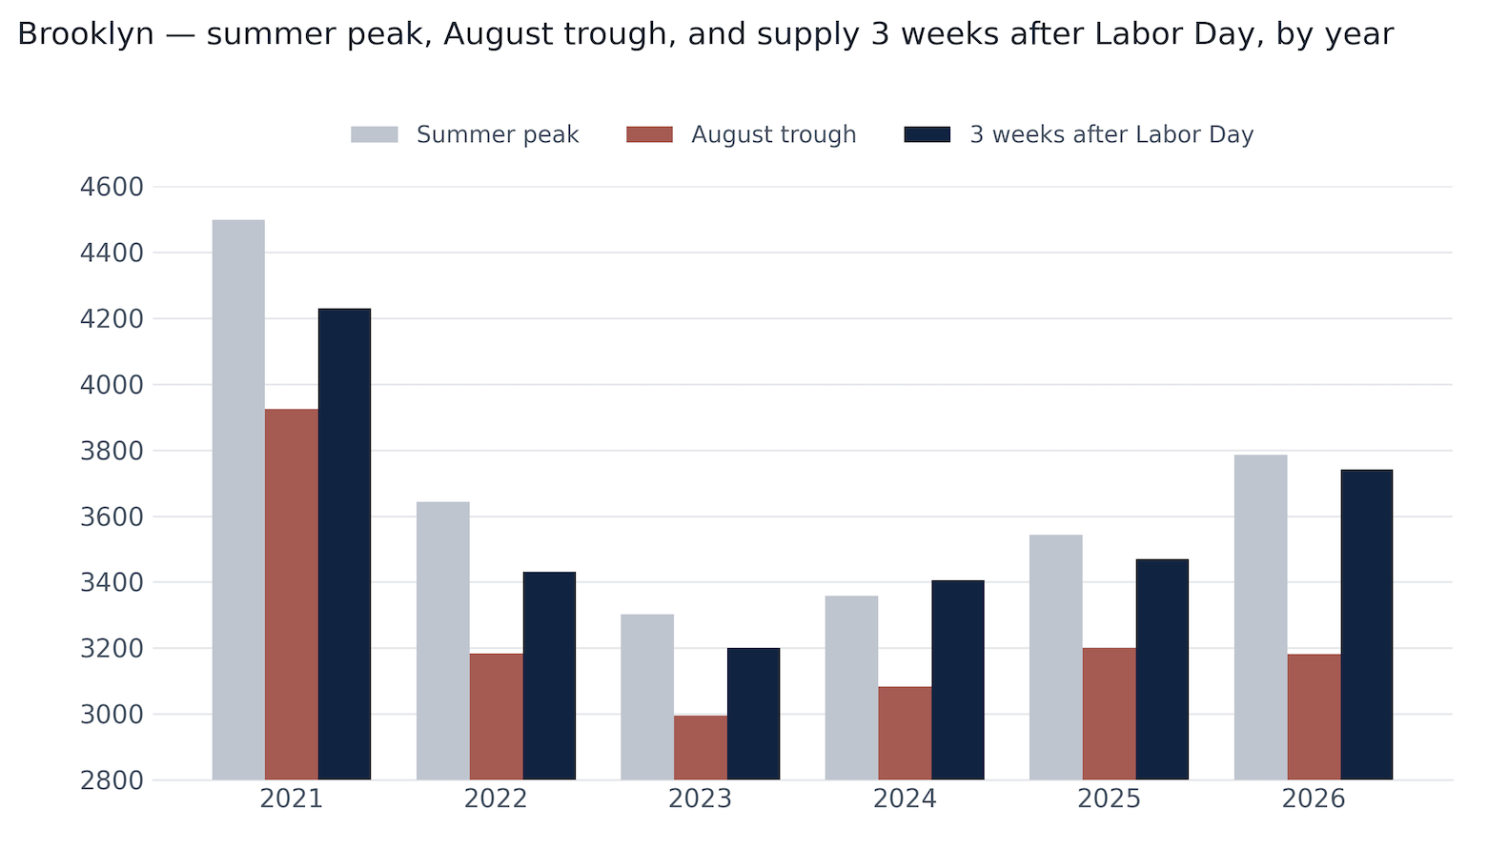
Brooklyn provides a useful contrast. Its 3,741 active listings represent approximately 8% more inventory than at the comparable point last year and the highest reading at this stage of the fall since 2021. Brooklyn has rebuilt approximately 93% of its summer peak-to-trough decline, with supply now about 5% above its end-of-July level.
Data sourced from UrbanDigs
Data sourced from UrbanDigs
Brooklyn buyers therefore have a broader selection relative to recent fall seasons. Whether that creates negotiating leverage depends on the demand for the specific property, neighborhood, and price range.
There is also more evidence behind the point we’ve been making throughout September: new to market doesn’t necessarily mean new to the market.
According to data from RealPlus, relistings in September accounted for 14.9% of Manhattan’s new sale listings, up from 13.4% last September. In Brooklyn, the share increased from 8.6% to 11.0%.
Most of the increase is due to properties making their first return within the tracking period. Manhattan’s count of listings relisted once increased from 257 to 326, while Brooklyn’s rose from 83 to 120. Properties relisted twice remained a small part of the picture.
RealPlus also separately tracks listings that were marked “Temporarily Off Market” before becoming available again. In its September comparison, those counts increased from 111 to 179 in Manhattan and 48 to 81 in Brooklyn.
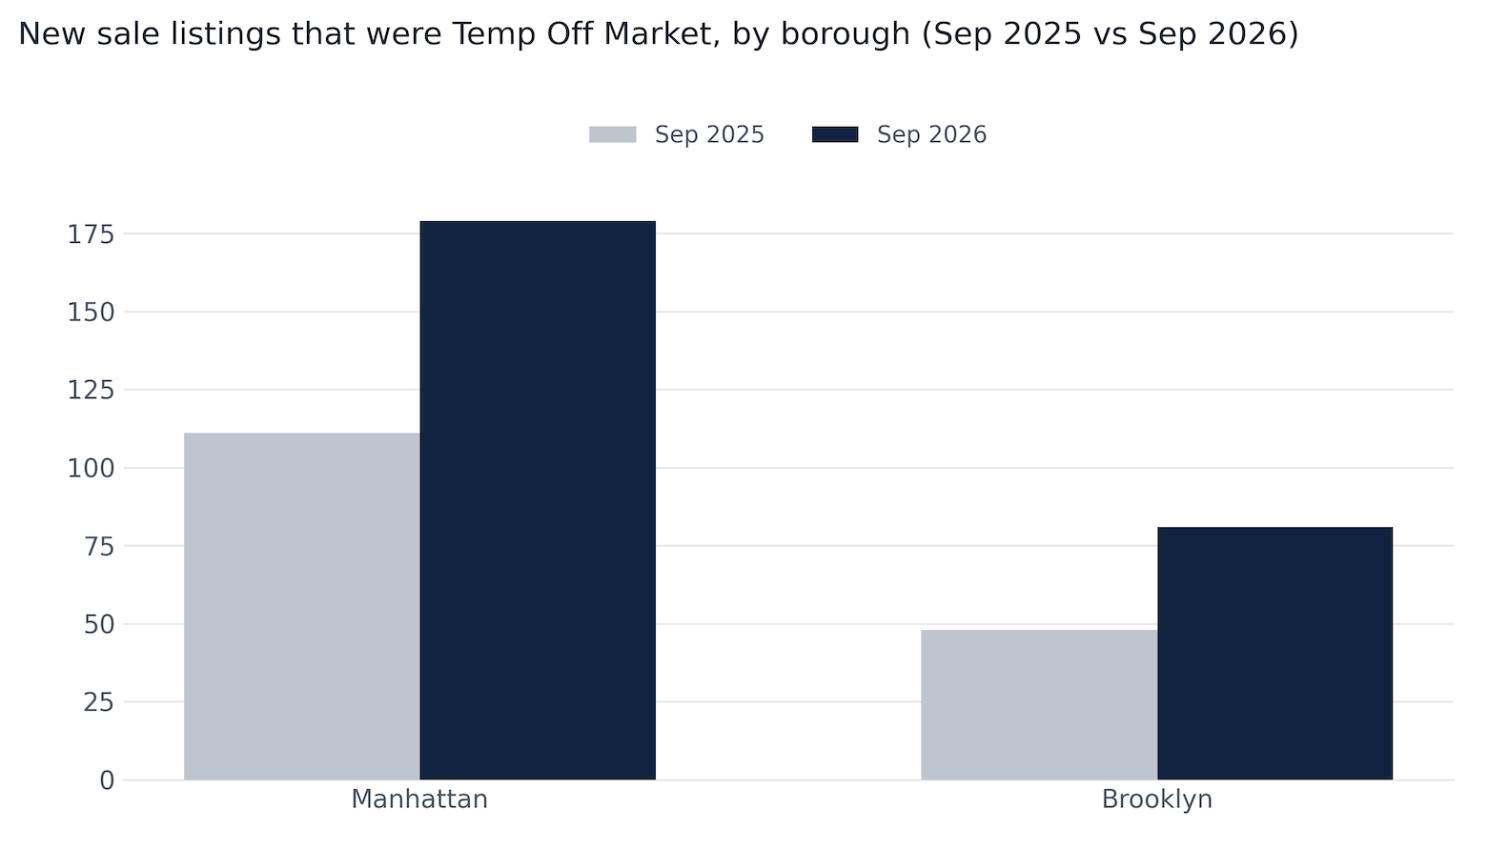
Data sourced from RealPlus
For buyers, a returning listing may present a worthwhile opportunity. But its full history matters: when it was first offered, its previous asking price, and what has changed since then. A fresh appearance doesn’t erase that context. The next question is how buyers are responding.
Last week, I highlighted theBrown Harris StevensOpen House Index report by Sara Rotter, which showed average attendance rising to 2.46 groups per open house, up 41% from the previous report in August. This week’s average declined. With Yom Kippur beginning last Sunday evening, some moderation was expected. Given the timing, I found the reported average turnout of 1.69 groups more encouraging than the week-to-week decline alone might suggest.
There was also a positive signal further along in the process. According to the CPL Law Market report, attorney Andrew Luftig saw a noticeable increase in new incoming deals last week, with accepted offers and deal sheets arriving as buyers and sellers engaged with his firm.
That matters because signed contracts take time to follow buyer interest. Negotiating an offer can take several days, followed by another five to seven business days for due diligence and contract preparation, sometimes longer. One firm’s experience doesn’t establish a market-wide trend. But if those incoming deals proceed to signing, that activity should begin appearing in contract figures over the coming weeks.
Against that encouraging backdrop, financing has become more expensive. According to Mortgage News Daily, the average 30-year fixed rate jumped to 7.43% on September 25, up from 7.20% the prior week, the highest level since May 2024. This continues a theme we’ve been discussing: buyers experience the market differently depending on their reliance on financing. Limited inventory can drive competition for desirable homes, while higher borrowing costs make buyers more price-sensitive.
For Manhattan buyers, the fall market offers more choices than August did, but still fewer than in comparable recent years. Review listing histories, keep financing estimates up to date, and evaluate each property against the alternatives that are actually available.
For sellers, the return of competing listings means that pricing and presentation remain incredibly important in determining whether, and how quickly, a listing finds a buyer. A relaunched property needs to make a compelling case to buyers who may remember seeing it earlier in the year.
August temporarily exaggerated Manhattan’s inventory shortage, and September has brought the picture back into clearer focus. What we’re left with is a market that remains short on supply, with the next chapter depending on how quickly buyers absorb what has returned.
Leave a Reply